> ## Documentation Index
> Fetch the complete documentation index at: https://ubicloud.com/docs/llms.txt
> Use this file to discover all available pages before exploring further.
# Logs
The Logs view of your Ubicloud PostgreSQL instance lets you browse logs from
your database directly in the Ubicloud console. You can also forward the same
logs to an external destination for long-term retention, alerting, or
correlation with the rest of your observability stack.
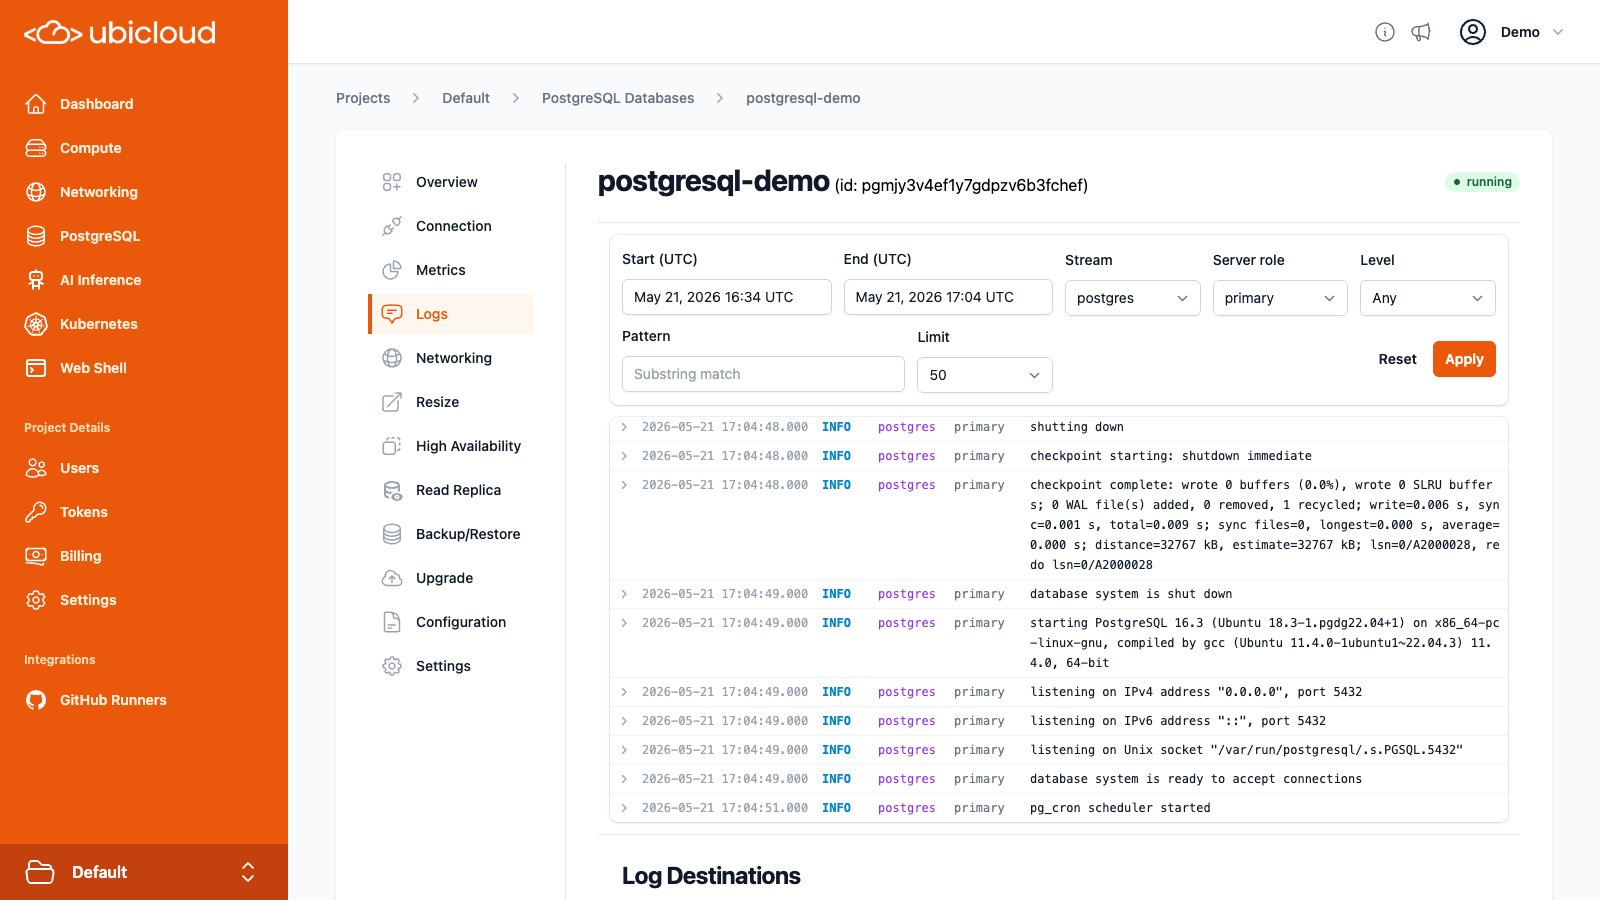 ## Browsing Logs
The Logs tab on the PostgreSQL details page provides a searchable view over
recent log lines from your instance. By default, it shows the last 30 minutes
of logs from the `postgres` stream on the `primary` server.
Logs are retained for up to 7 days. A single query can span at most 24 hours
of that range.
### Filters
The following filters are available at the top of the Logs view:
* **Start / End (UTC)**: The time range to query. Defaults to the last 30
minutes. The range must be at most 24 hours and cannot start more than 7 days
in the past.
* **Stream**: The source of the log line.
* `postgres` — log lines emitted by the PostgreSQL server itself.
* `pgbouncer` — log lines from the PgBouncer connection pooler.
* `upgrade` — log lines from in-place major version upgrades.
* **Server role**: `primary` or `standby`. For instances with HA enabled, this
selects which server's logs to display.
* **Level**: Filter by severity. One of `DEBUG`, `INFO`, `WARN`, `ERROR`, or
`FATAL`.
* **Pattern**: A substring to match against the log message. Up to 200
characters.
* **Limit**: The maximum number of log lines to return. One of 50, 100, 250,
or 500.
Click **Apply** to run the query, or **Reset** to clear all filters back to
their defaults.
### Reading log entries
Each row shows the timestamp (UTC), severity level, stream, server role, and
the log message. Severity levels are color-coded — `ERROR` and `FATAL` are
shown in red, `WARN` in yellow, and `DEBUG` in gray.
Rows with additional context (such as `pid`, `dbname`, `user`, `app_name`, or
`remote_host_port`) can be expanded to reveal those fields.
If more matching logs are available than fit within the selected time range, a
banner at the top of the results lets you load the next page or suggests
increasing the limit.
## Log Destinations
You can forward logs from your Ubicloud PostgreSQL instance to an external
destination for long-term retention, alerting, or correlation with the rest of
your observability stack. Logs are shipped by an OpenTelemetry Collector
running alongside the database.
## Browsing Logs
The Logs tab on the PostgreSQL details page provides a searchable view over
recent log lines from your instance. By default, it shows the last 30 minutes
of logs from the `postgres` stream on the `primary` server.
Logs are retained for up to 7 days. A single query can span at most 24 hours
of that range.
### Filters
The following filters are available at the top of the Logs view:
* **Start / End (UTC)**: The time range to query. Defaults to the last 30
minutes. The range must be at most 24 hours and cannot start more than 7 days
in the past.
* **Stream**: The source of the log line.
* `postgres` — log lines emitted by the PostgreSQL server itself.
* `pgbouncer` — log lines from the PgBouncer connection pooler.
* `upgrade` — log lines from in-place major version upgrades.
* **Server role**: `primary` or `standby`. For instances with HA enabled, this
selects which server's logs to display.
* **Level**: Filter by severity. One of `DEBUG`, `INFO`, `WARN`, `ERROR`, or
`FATAL`.
* **Pattern**: A substring to match against the log message. Up to 200
characters.
* **Limit**: The maximum number of log lines to return. One of 50, 100, 250,
or 500.
Click **Apply** to run the query, or **Reset** to clear all filters back to
their defaults.
### Reading log entries
Each row shows the timestamp (UTC), severity level, stream, server role, and
the log message. Severity levels are color-coded — `ERROR` and `FATAL` are
shown in red, `WARN` in yellow, and `DEBUG` in gray.
Rows with additional context (such as `pid`, `dbname`, `user`, `app_name`, or
`remote_host_port`) can be expanded to reveal those fields.
If more matching logs are available than fit within the selected time range, a
banner at the top of the results lets you load the next page or suggests
increasing the limit.
## Log Destinations
You can forward logs from your Ubicloud PostgreSQL instance to an external
destination for long-term retention, alerting, or correlation with the rest of
your observability stack. Logs are shipped by an OpenTelemetry Collector
running alongside the database.
 Two destination types are supported:
* **OTLP HTTP**: Sends logs to an OTLP-compatible HTTP endpoint over HTTPS.
Authentication is performed via HTTP headers (e.g., an `Authorization`
header or a vendor-specific API key header).
* **Syslog (RFC 5424 over TLS)**: Sends logs as RFC 5424 messages over a TLS
TCP connection. Authentication is performed via syslog structured data
elements, which many providers use to identify the account or stream.
Each log record forwarded to a destination contains a unified set of fields,
including the message body, severity, stream (`postgres`, `pgbouncer`, or
`upgrade`), the server's ubid as the `instance`, and the server role
(`primary` or `standby`). For `postgres` stream entries, additional
attributes such as `pid`, `dbname`, `user`, `app_name`, and
`remote_host_port` are included when available.
Only `https://` URLs are accepted for OTLP destinations, and only `tcp://`
URLs for syslog destinations. In both cases, data is encrypted in transit.
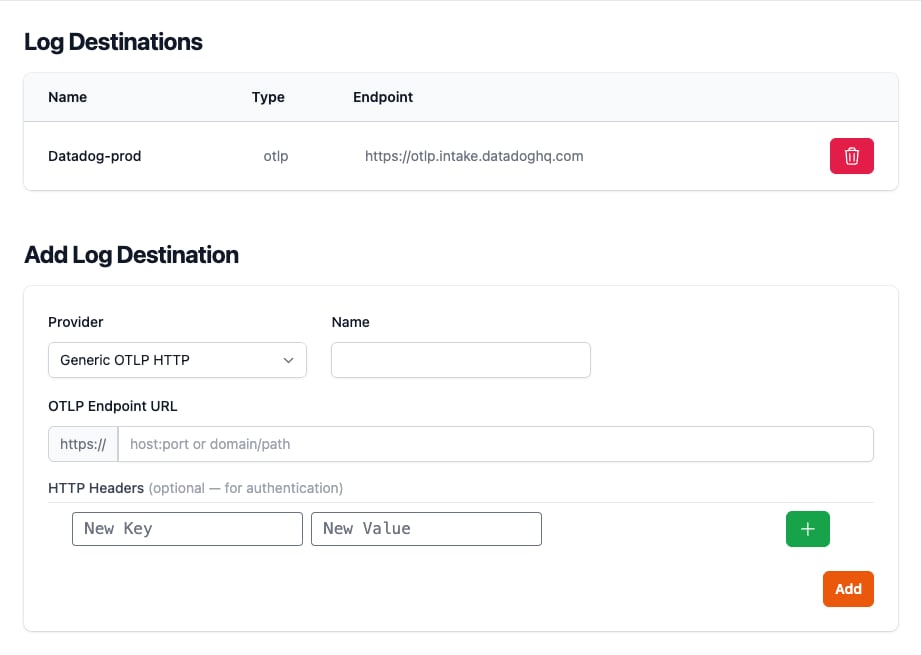
### Adding a Log Destination
Open the **Log Destinations** tab on your PostgreSQL instance's details page.
The **Add Log Destination** section provides a form to configure a new
destination:
* **Provider**: Select your logging provider from the dropdown. Presets are
available for common providers such as Grafana Cloud, Datadog, New Relic,
Honeybadger, Better Stack, Sumo Logic, OpenObserve, Mezmo, Loggly, Logentries,
and Papertrail. Selecting a preset fills in the destination type, endpoint,
and required authentication fields for you. You can also pick **Generic OTLP
HTTP** or **Generic Syslog** to configure a destination manually.
* **Name**: A name to identify this destination.
* **Endpoint**: The destination URL. The protocol prefix (`https://` for OTLP
or `tcp://` for syslog) is fixed based on the selected type.
* **Authentication**: For OTLP destinations, add the HTTP headers required by
your provider (e.g., an `Authorization` or API key header). For syslog
destinations, add the RFC 5424 structured data elements your provider uses
for authentication.
Click **Add** to save the destination. Logs will begin forwarding shortly
after.
The same can be done using the Ubicloud [API](/api-reference/overview) or the
[`ubi` CLI](/quick-start/cli).
### Listing and Removing Log Destinations
The **Log Destinations** tab lists all configured destinations along with
their name, type, and endpoint. To remove a destination, use the delete button
next to it.
Log destinations can also be listed and removed via the API and CLI.
### Tested Providers
Log destinations use the OTLP HTTP and RFC 5424 syslog protocols and should
work with any provider that supports them. The following providers have been
verified end-to-end:
* Mezmo
* OpenObserve
* Honeybadger
Two destination types are supported:
* **OTLP HTTP**: Sends logs to an OTLP-compatible HTTP endpoint over HTTPS.
Authentication is performed via HTTP headers (e.g., an `Authorization`
header or a vendor-specific API key header).
* **Syslog (RFC 5424 over TLS)**: Sends logs as RFC 5424 messages over a TLS
TCP connection. Authentication is performed via syslog structured data
elements, which many providers use to identify the account or stream.
Each log record forwarded to a destination contains a unified set of fields,
including the message body, severity, stream (`postgres`, `pgbouncer`, or
`upgrade`), the server's ubid as the `instance`, and the server role
(`primary` or `standby`). For `postgres` stream entries, additional
attributes such as `pid`, `dbname`, `user`, `app_name`, and
`remote_host_port` are included when available.
Only `https://` URLs are accepted for OTLP destinations, and only `tcp://`
URLs for syslog destinations. In both cases, data is encrypted in transit.
### Adding a Log Destination
Open the **Log Destinations** tab on your PostgreSQL instance's details page.
The **Add Log Destination** section provides a form to configure a new
destination:
* **Provider**: Select your logging provider from the dropdown. Presets are
available for common providers such as Grafana Cloud, Datadog, New Relic,
Honeybadger, Better Stack, Sumo Logic, OpenObserve, Mezmo, Loggly, Logentries,
and Papertrail. Selecting a preset fills in the destination type, endpoint,
and required authentication fields for you. You can also pick **Generic OTLP
HTTP** or **Generic Syslog** to configure a destination manually.
* **Name**: A name to identify this destination.
* **Endpoint**: The destination URL. The protocol prefix (`https://` for OTLP
or `tcp://` for syslog) is fixed based on the selected type.
* **Authentication**: For OTLP destinations, add the HTTP headers required by
your provider (e.g., an `Authorization` or API key header). For syslog
destinations, add the RFC 5424 structured data elements your provider uses
for authentication.
Click **Add** to save the destination. Logs will begin forwarding shortly
after.
The same can be done using the Ubicloud [API](/api-reference/overview) or the
[`ubi` CLI](/quick-start/cli).
### Listing and Removing Log Destinations
The **Log Destinations** tab lists all configured destinations along with
their name, type, and endpoint. To remove a destination, use the delete button
next to it.
Log destinations can also be listed and removed via the API and CLI.
### Tested Providers
Log destinations use the OTLP HTTP and RFC 5424 syslog protocols and should
work with any provider that supports them. The following providers have been
verified end-to-end:
* Mezmo
* OpenObserve
* Honeybadger